Get complete visibility into how every unit of energy is consumed, lost, or optimised in your building.
ENERGY MANAGEMENT
Know Your Energy. Maximise Efficiency.
Get complete visibility into how every unit of energy is consumed, lost, or optimised in your building.
SMARTER ENERGY DECISIONS
Energy Insights That Matter
MORE THAN JUST MONITORING
Maximise Every Unit. Minimise Every Cost.
15%
Reduce Energy Waste
Cut avoidable energy losses.
Optimise Power Factor
Improve power factor & Load balancing.
90%
Forecast Energy Demand
Forecast energy use with accuracy.
Track Energy Use
Enable granular energy accountability by zone or team.
TRACK. SEGMENT. PREDICT. OPTIMISE.
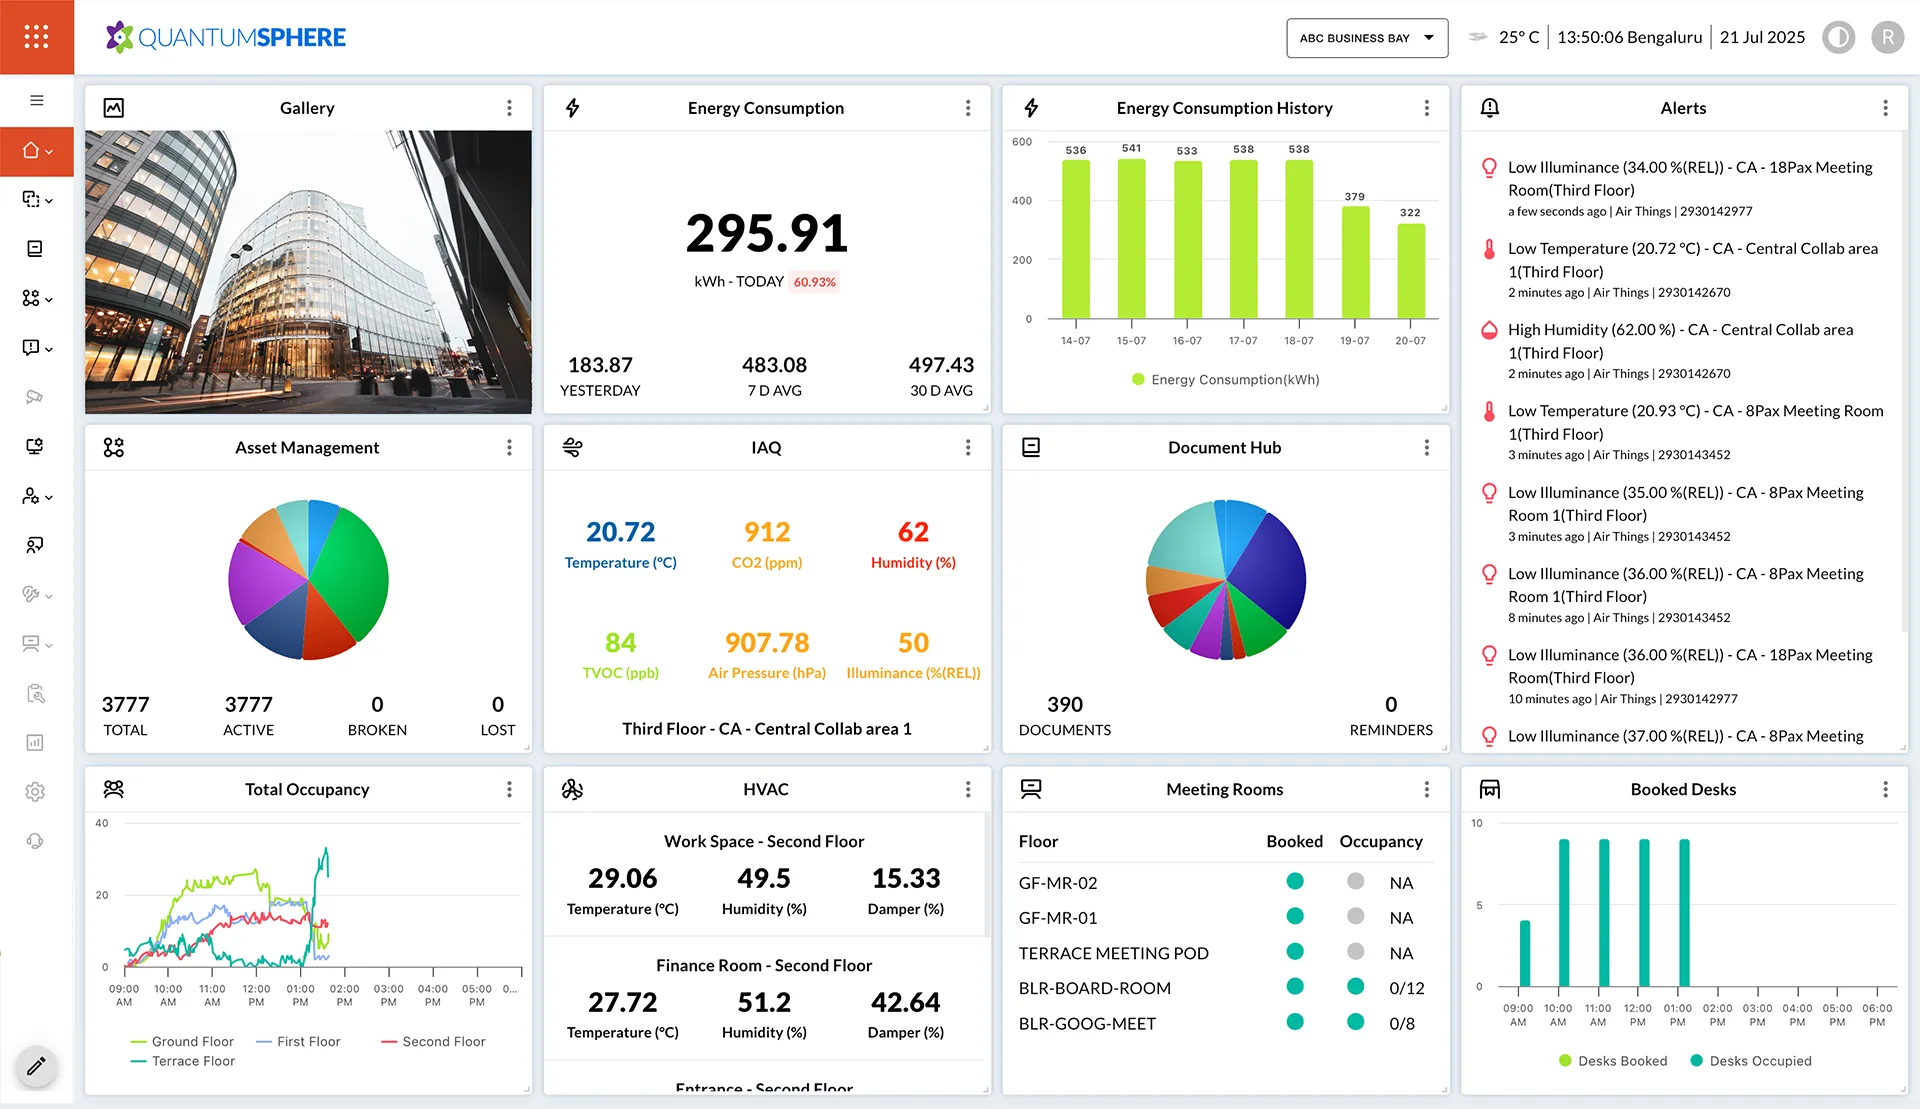
Total Energy Control at Your Fingertips
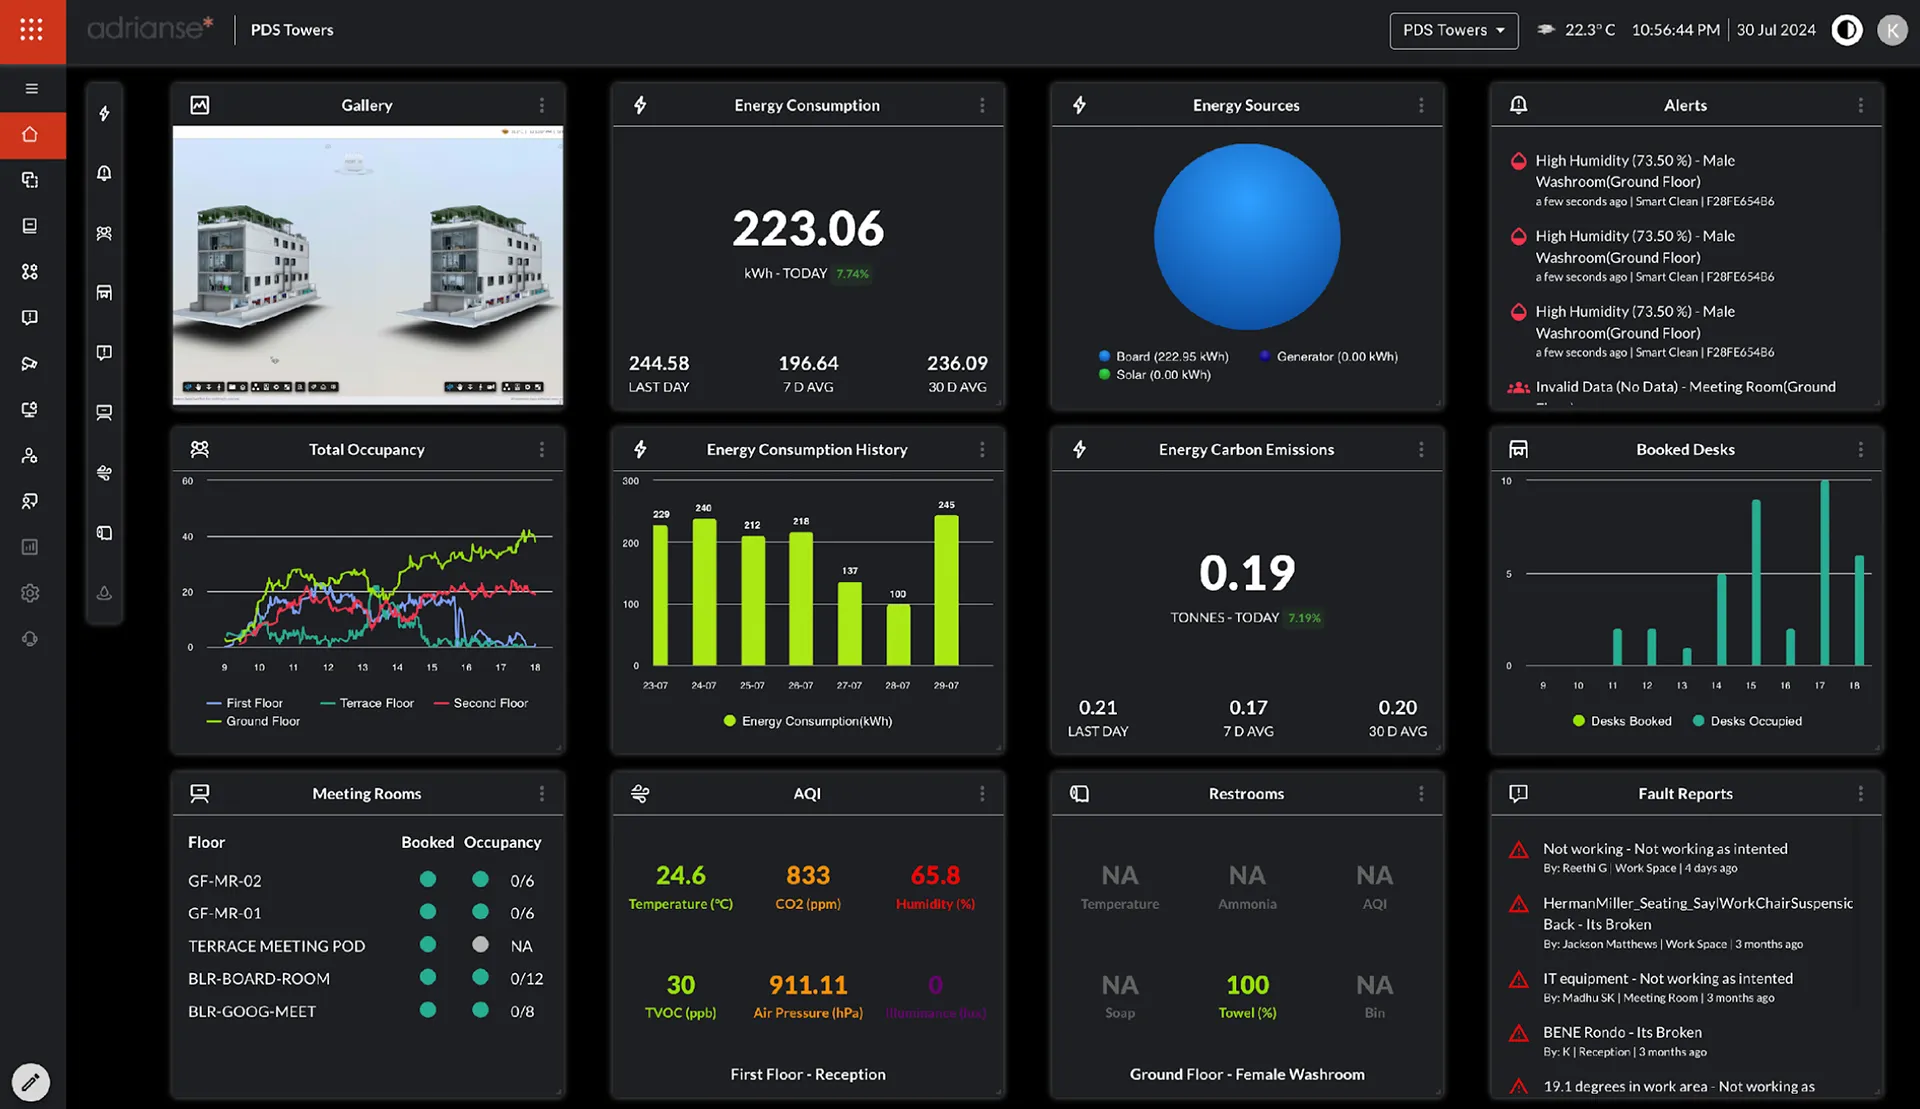
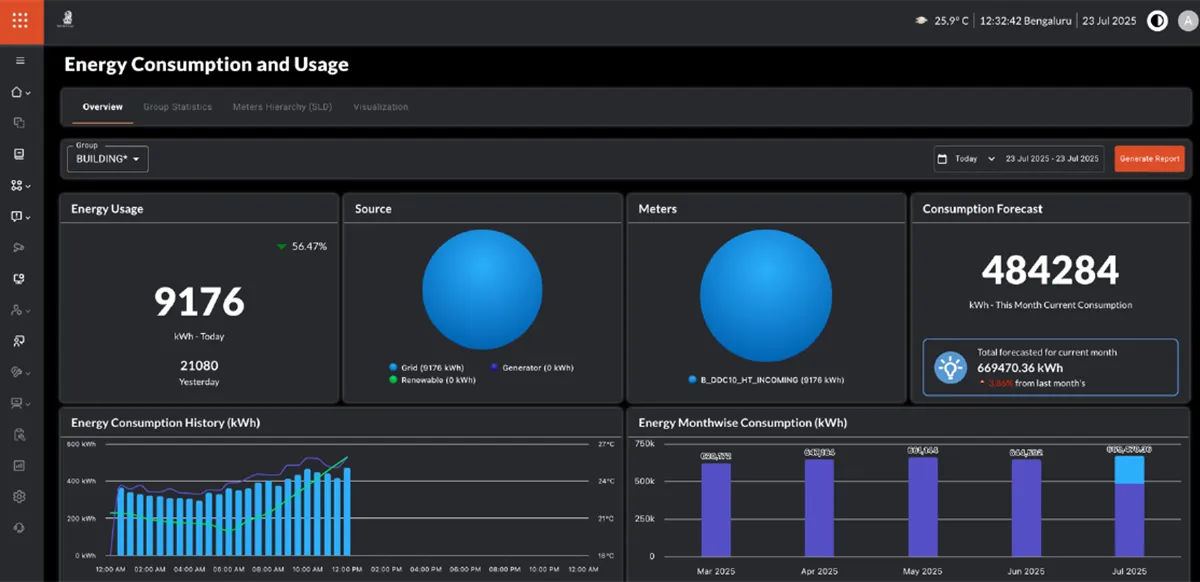
Energy Overview Dashboard
See total usage, sources, and trends in one view.
Meter Grouping
Organise meters by floor, system, zone, or building function.
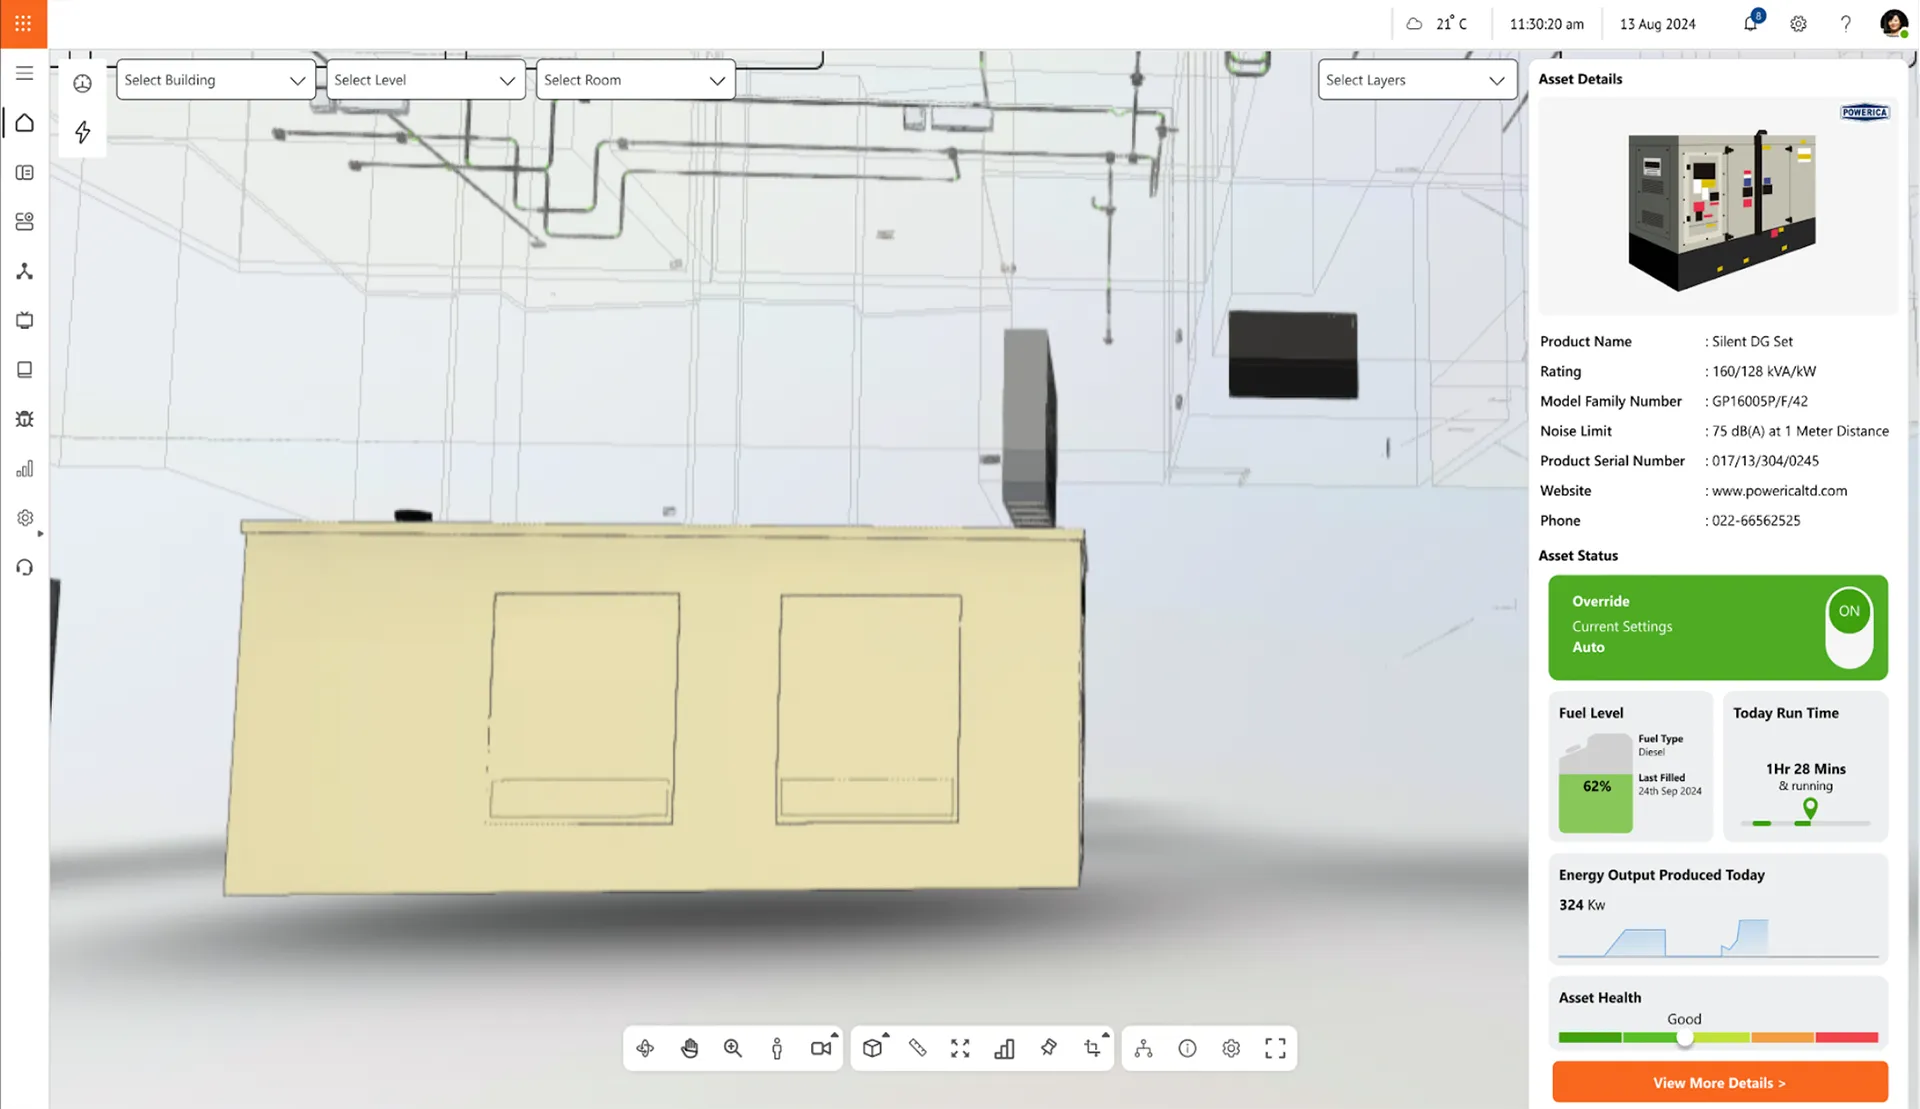
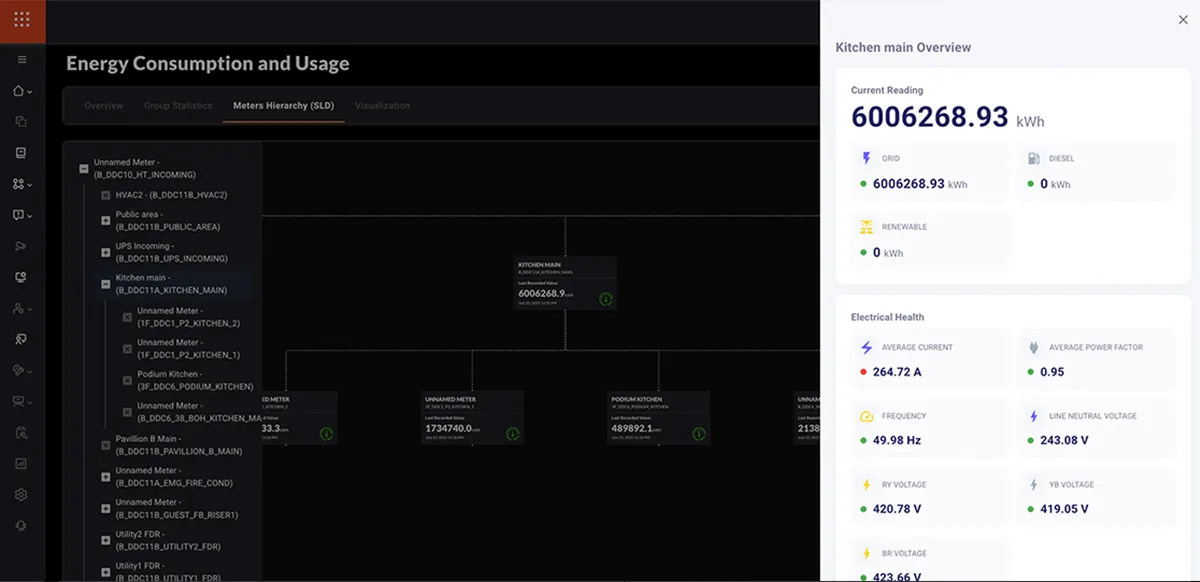
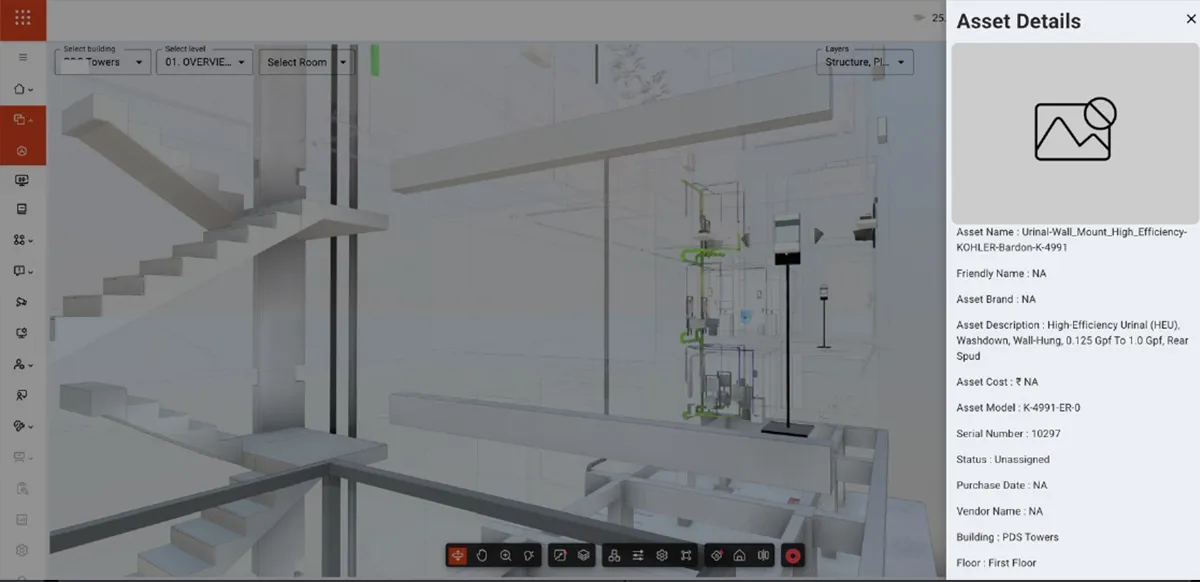
SLD (Single Line Diagram)
Visual map of your electrical infrastructure.
Energy Distribution Tree
Understand how energy flows across systems.
Loss Tracking
Identify and isolate loss between parent and child meters.
Consumption Forecasting
AI-driven models to predict future loads and costs.
Reporting Engine
Auto-generate audit-ready, downloadable reports.
Carbon Impact Layer
View usage in terms of emissions and ESG metrics.
REAL-TIME INTELLIGENCE FROM SOURCE
Real-Time Intelligence from Source to Socket
How It Works
Experience comprehensive energy control. Our optimisation cycle provides a clear path to reduced costs, lower emissions, and a truly sustainable energy footprint.
1
Connect & Ingest
Pull data from main and sub-meters across all energy systems.
2
Segment & Analyse
Break down usage by system type or physical zones.
3
Visualise Flow & Losses
Map energy flow with SLDs and identify inefficiencies node by node.
4
Forecast & Optimise
Predict peak demand, future costs, and carbon impact for smarter planning.
YOUR ENERGY ECOSYSTEM CONNECTED
Connect What Powers You
Nhance EMS integrates with your existing energy meters (Modbus/BACnet), BMS systems, solar/wind sources, and CAFM platforms. It offers scalable support for high-frequency data and intelligent data mapping for any building type.
From Towers to Campuses: Energy Visibility at Scale
Usecases
Facilities face shared energy challenges, regardless of type. Nhance adapts to these common issues, providing versatile solutions that meet diverse needs and drive universal efficiency.
Commercial Towers Segment energy use by tenant and system.
Smart Campuses Track distributed energy across buildings.
Industrial Units Compare load, capacity, and loss to monitor performance and optimise efficiency.
Hospitals Optimise backup power and life-critical systems.
Retail Malls Match energy spikes to peak occupancy and operations.
Maverick
is Nhance’s agentic AI designed to support every service across your building portfolio. Built on the open-architecture Context Model Protocol (CMP), it understands the context of your spaces - who’s using them, how they perform, and what they need next.
With dedicated AI agents for energy, maintenance, workplace experience, and more, Maverick turns building data into real-time action. This allows teams to move from reactive fixes to predictive management, optimising efficiency and user satisfaction.
MEASURED SAVINGS, PROVEN RESULTS
Real Results with Nhance EMS
Energy waste is a silent budget drain. These companies didn’t guess, they acted. See what Nhance uncovered (and how much they reclaimed).